Pricing-in the ETH merge
As with all major financial events, traders ask the question “What’s the market pricing-in?”. Mid-September we are expecting a fairly major change in the digital asset markets when Ethereum is planning to move from “proof-of-work” (PoW) to “proof-of-stake” (PoS).
The existing proof-of-work is the validation of blocks performed by Ethereum miners which is an energy intensive process and very much out of favour in these environmentally conscious times. Proof-of-stake is a low energy alternative used by a number of other chains such as Cardano, Avalanche, Polkadot and Solana.
There are plenty of resources out there for the curious to learn everything there is to know about these different mechanisms, the pros and cons of each and the forthcoming change itself. Here we will be doing a deep-dive into how this market moving event is being priced-in by the ETHUSD Options market.
Vol Surface Representation
At Immersive Finance, we are currently publishing from one of our live dashboards, transformed exchange market data into a form familiar to over-the-counter (OTC) traders. This is our proprietary Volatility Surface representation. We push this valuable information out onto Twitter via our Market Insights account daily, as well as to our dedicated Telegram channel.
Before we get to the main thrust of this article, it is worthwhile taking a look at a recent market snapshot, derived from the traded instruments on Deribit exchange.

The crypto options market is, at present, predominantly exchange traded with a set of expiries and a range of strikes for each of these expiries. OTC traders are familiar with reducing this information (there are over 600 ETHUSD option contracts, for example, being quoted on Deribit) into a small number of points per expiry — five points being most common.
Above shows the transformed data coming from Deribit for the currently traded expiries. As well as the level of the underlying futures contract, we have the 10-delta calls and puts, the 25-deltas and the at-the-money forward (ATMF) option volatilities. This volatility surface gives the trader a high level overview of the surface.
We will leave the details of such a volatility surface representation for another article but highlight that these points are chosen to span the asset distribution. The OTC market tends to avoid using fixed strikes because large movements in the underlying can leave those options worthless and thereby convey little information. If we work with deltas then they always correspond to contracts with meaningful value.
When we look at the ATMF volatilities we see there is a large step up from the 09-SEP-22 implied volatility to that of the 30-SEP-22 expiry — this spread has been trading around 10 vols recently! Between these dates is the expected “Ethereum Merge”.
Options Traders are telling us something… let’s hear them!
The expected date of the PoW to PoS change (the “Ethereum merge”) is around the 15-SEP-22. We see the ATMF vol is pricing-in a period of heightened volatility. Assuming constant forward variance, around 109%, in fact. Our question though, is: what is the rest of the smile telling us?
Visually, we see that put options trade at a higher vol than the corresponding call. For example, the 25-delta put option trades at 107.55% versus 101.41% for the call. At 10-delta the put is 117.66% versus 107.05% for the call. This asymmetry is referred to traders as ‘skewness’. The ETHUSD surface is highly negatively skewed. Options to protect (or indeed take a position) on the downside are more expensive than those on the upside.
An Options Trader’s Implied Probability
A common way we (quants and traders) try to answer this question is by looking at the market implied (risk-neutral) probabilities in the form of a contract known as a European digital. A European digital is a straight bet: you get a dollar if the underlying at expiry ends beyond a level set today. If it does not exceed that level, then the payout is zero.
In the above example, the 30-SEP-22 future is trading at 1,621.94. We could enter into a contract where I pay you $1 on 30-SEP-22 if ETHUSD ends beyond, say, 2,000; otherwise nothing. Suppose this contract costs 20 cents to enter into, then we can think of this as the market pricing in a 20% probability of ETHUSD trading beyond this level. We call these risk-neutral-probabilities, very familiar to TradFi quants and the backbone of much of option pricing theory.
[Technical point: It can get a bit confusing if we compare this to the contract where the payout is set to be 1 ETH (not $1) if ETHUSD traded above 2,000. That contract would not cost 0.20 ETH but something different — and that’s a conversation for another time. Let’s keep our focus on USD payouts.]
So, how do we calculate these (risk-neutral) probabilities? Well there are a couple of ways. We can think of a European digital call (put) as a very tight call (put) spread and price those directly off the (interpolated) smile, or we can do a more formal calculation using the slope and curvature off our constructed smile itself.
We will cover both in the technical appendix below for the interested reader. But first, let’s take a closer look at what the market is telling us.
Market Implied Probabilities in the ETHUSD Market
The post-merge expiry currently trading in the market is 30-SEP-22 and from those traded options we can, using our analytics engine, build the market implied (risk-neutral) density. There are a couple of ways to look at the information.
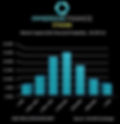
Firstly, we can look at absolute levels. Where is the market currently pricing ETHUSD ending in different regions on 30-SEP? Below we group these into 500 point blocks.

Now, as the underlying token value changes, these probability blocks will rise and fall. This is just a snapshot of the market! What we see is how probability is skewed to the downside — there vols are higher, due to increased option protection buying which manifests itself with a negatively skewed implied distribution.
An alternative is to look at sizes of market moves. For example, the market implied probability of a move down between 10% and 30% or a move up in excess of 50% say.
As before, the options market is skewed more to the downside. We can also consider the probability of a large move in either direction. For example, the implied probability of a move in excess of 30% is currently around 33%.
At Immersive Finance we track these probabilities realtime and a whole range of market metrics to understand the dynamics of the ETHUSD options market at a deeper level.
If you’d like to know more, follow us on Twitter or join our Telegram group.
If you’d like to discuss our platform then reach out to us at info@immersive-finance.com
Technical Appendix
European Digital as an Option Spread
Suppose we are interested in receiving $1 when the asset trades above the level K. Consider a call spread with strikes

and with notional

The notional is chosen so the payoff is equal to $1 above the higher strike. This call spread will have payoff

There are three regions of interest:
As the difference between the two option strikes gets squashed and finally disappears we are left with the European digital call payout.
Breeden-Litzenberger
All quants will (should!) be familiar with the following — it actually dates back to the very early days on (modern) option theory to 1978. We will drop all the technical conditions for ease of understanding.
Suppose we have a terminal asset probability density that we will denote

then the undiscounted value of a call option with strike K is given by

The undiscounted value of a digital call option paying $1 if S(T) ends above K will be

If we know all the call option prices i.e. C(K,T) for all K, then we are able to recover the underlying asset density.
Splitting the call option equation

and partially differentiating with respect to the strike

and just for completeness

Therefore, from the vanilla smile we can recover both the European digital prices as well as the market implied risk-neutral probability density function via

When the volatility is a function of the strike, we can use the Black-Scholes equation to reprice the options that trade in the market. Doing so gives the European digital price via